 Category:
I compiled some stats from 2008 to 2013 to get you guys in the mood for the 2014 season.
Somewhat unsurprising is that the Waterdown Bulldogs really show how much a powerhouse they’ve been in the last six years.
What did surprise me is the almost perfect correlation between goals for and points. Goals against seems to make a very small difference!
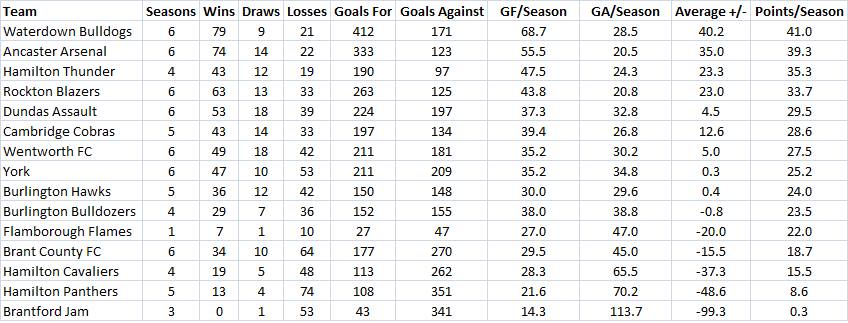
Totals – 4.24 goals per game average.
2008 – 13 teams – 21 points needed to make playoffs
2009 – 13 teams – 18 points needed
2010 – 14 teams – 22 points
2011 – 13 teams – 23 points
2012 – 11 teams – 18 points
2013 – 9 teams – 8 points
2014 – 9 teams – ?
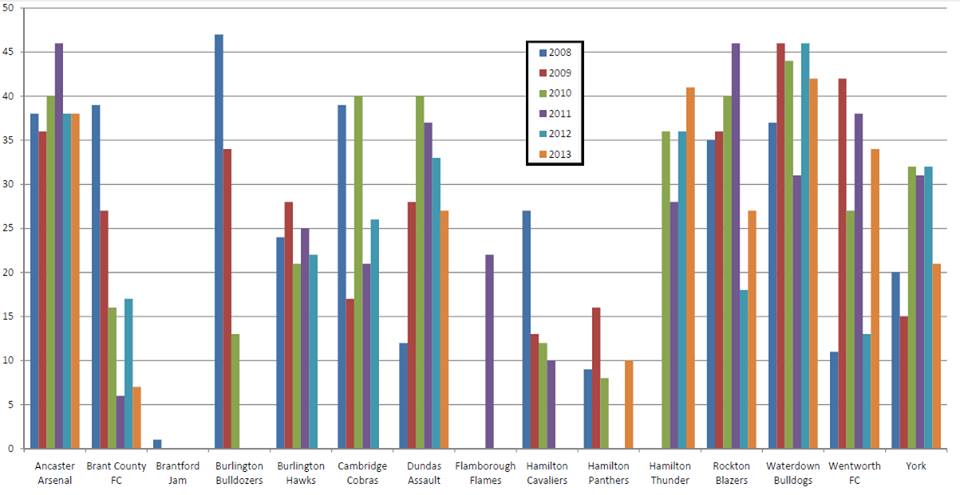
The second image shows the points at the end of the regular season for each team through the years. It shows how (in)consistent your team is. Compare Ancaster to Dundas!
The best record in this time period was the Bulldozers in 2008: 15W,2T,1L for 47 points. 46 points was reached four times since 🙂
What are you predicting for 2014?

Leave a reply